
Click image to embiggen.

Making sure you’re in the know
Things are constantly changing on the social media landscape. If you made it a priority to track of Facebook’s latest algorithm change and the latest social media buzzword you wouldn’t even have time to get your work done. Luckily for you, that’s our job.
On that note, we thought we would update you on a couple of recent changes that could have a significant effect on our outreach efforts. There’s tons more happening, of course (are you following us on Twitter and Facebook for regular updates?), but these are two pretty big ones that we want to make sure you know about:
1. Facebook pages
Facebook is changing the way it shows page posts in people’s feeds — basically they are downgrading the value of all page posts, so while it will still help to have the sort of good content that generates real engagement, it is even then going to be harder and harder to even show up in people’s feeds without paying for ads.
Some time around the beginning of December, Facebook changed its algorithm in such a way that every user’s news feed was tweaked slightly – more relevant, newsy-type stories and shared articles by friends would be seen, but at the expense of posts by pages. Many businesses, including small-to-medium-sized businesses that can’t really afford huge marketing budgets, saw the potential of social media marketing some years back and have built up healthy followings and a good number of likes on their Facebook pages. However, this recent move by Facebook is an attempt to get companies to pay to reach these audiences.
“We expect organic distribution of an individual page’s posts to gradually decline over time as we continually work to make sure people have a meaningful experience on the site. We’re getting to a place where because more people are sharing more things, the best way to get your stuff seen if you’re a business is to pay for it,” says a document produced by Facebook.
2. Gmail Servers
Gmail is changing the way it hosts images, which — without going into the technical nitty-gritty — means we are going to have a harder time tracking when people actually open/read emails. This means open rates are going to go down across the board, and will not be reflective of actual open rates. The open-rate metric has always been a proxy, but this information can amount of any drop we see.
Google has just announced a move that will shut most of these tactics down: it will cache all images for Gmail users. Embedded images will now be saved by Google, and the e-mail content will be modified to display those images from Google’s cache, instead of from a third-party server. E-mail marketers will no longer be able to get any information from images—they will see a single request from Google, which will then be used to send the image out to all Gmail users. Unless you click on a link, marketers will have no idea the e-mail has been seen.
More details on this change available here.
We’re not sure yet how these changes will be affecting our clients and services, but we are hard at work here figuring out how to make your online outreach efforts work for you, and we have ideas cooking on both fronts to make sure we’re changing tactics to account for these changes.
Compare These 5 Social Analytics Tools
As we starting looking into how we could improve our client services in 2014, high on our list was a more robust social analytics reporting system. We currently use a patchwork of free and low-cost services, but for the number of clients we’re managing and the level of sophistication we need to reach to take accounts to the next level of outreach and engagement, as well as to increase our internal efficiency and reporting abilities, we did some investigating of some more well-developed social analytics tools.
There are dozens (if not hundreds) of these tool sets available — we investigated five of the highest ranked, most used, and more feature-rich options.
Below is a matrix of the tools we investigated, cost estimates for implementing them, and an overview of the range of services they offer.
1. Sprout
A reasonably priced, fairly comprehensive option with clean graphics and polished interface.

2. Quintly
Tons of data, lots of options. Moderate price point, excellent customer service.

3. Simply Measured
A great service for those with a higher budget. Well rounded, great graphics, and tons of options.

4. Hootsuite
A great tool for managing multiple social media accounts; not as good at reporting, and getting anything but basic data becomes expensive quickly.

5. Cyfe
Designed for large organizations to track across a huge array of customer service tools, Cyfe nonetheless does a great job at social media analytics, especially for the price. The graphics are a little clunky, but this is a superb budget option.

We also investigated several tools designed for more broad media tracking, like Vocus and Meltwater Buzz, which had social media tracking components. While the tracking and analytics for these services was very sophisticated, the pricing (starting at about $1k per month) put them out of reach for anyone who doesn’t have extensive media and social tracking needs.
How to decipher your data
Goals without measurable metrics attached to them aren’t really worth much. Likewise, setting goals without intending to check back in to see how you’re doing probably ends up feeling like a waste of time.
From the get-go, you should be conceiving of goal-setting as a giant feedback loop:

Once we have goals that are specific, measurable and time-oriented (click here for more on that), we can think about what kind of data will be relevant to checking in on our progress.
How do we track?
Each aspect of our campaign or project has a data set associated with it.
Email
Virtually every email blast service tracks a standard set of metrics for every email you send. (And if your email blast service doesn’t, it’s not worth using.) The standard metrics are:
- Open Rate
This is the most basic measure of the success of an email blast, but don’t give it too much weight. For one thing, it’s a fuzzy number to measure because email blast services can’t really tell you exactly how many people read your email. Instead, they use a proxy in the form of a little invisible pixel embedded in every email. Every time that pixel is downloaded from their server, it counts as one open. So if someone has images blocked (as many – if not most – people do) it would depress the actual open rate; likewise if someone’s email program automatically downloads images when they load their email, irrespective of weather or not they actually read it, it could artificially inflate the rates.It’s also much less relevant to know how any unique email performs compared to some abstract number (what does 35% open rate mean? Is that good or bad?), and much more important to track how your rates change relative to each other. Every email list is a little different, so there may not really be a standard, across-the-board “good” open rate…but if your lists’ average is 13%, and an email gets 6%, it’s worth trying to find out why.A few under-performing emails, as measured by a simple open-rate metric, often don’t tell the whole story — appeal kickers that have lower open rates might be the biggest money earners, for instance. - Click-through Rate (CTR)
CTR is in some ways a much better measure of the success of any email. Unlike with Open Rates, CTR is an accurate count of how many people not only read your email, but were also inspired enough to take the additional step of spending additional seconds clicking through. It may not result in the actions or donation totals you were hoping for, but in a world where time and email inbox space are at a premium, a relatively high CTR counts as a pretty ringing endorsement of your email’s subject line and content. - Unsubscribe Rate
Sending too many emails a month? Not enough? Confusing people with misleading subject lines or appeals they weren’t expecting? Unsubscribe rates are an important way for us to realize that we’re doing something wrong. As with Open Rates, the overall average is worth less attention than a major spike or drop off. - Bounce Rate
This is what tells us how many bad email addresses we have on our lists. It shouldn’t jump or drop unexpectedly, but it’s worth paying attention to. Lists with high bounce rates tend to get flagged by email service providers as likely spam, meaning your email is more likely to end up in someone’s junk folder, where it’s not doing anyone any good.
Web Sites

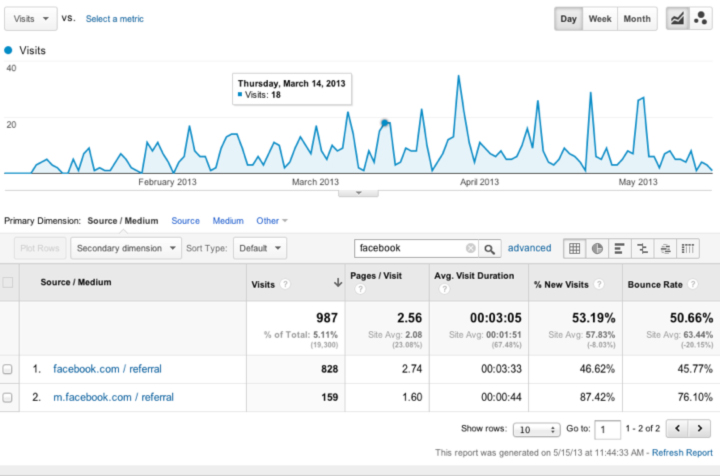
You can use analytics to see what content is coming in from mobile browsers. (Click to embiggen)
Google Analytics is the gold standard of web site analytics tools, and has the added benefit of being the free-ist. The interface is intuitive and actually kind of fun to play with, but the amount of data presented can be overwhelming. Whatever analytics tool you’re using to measure the effectiveness of your web site, here are the key metrics to take ongoing note of:
- Overall site views
Much like “Open Rates”, this is a metric best utilized in relative, not absolute, terms. A big spike or drop in traffic is a flag worth investigating; likewise a long, slow increase or decrease in hits. - Unique Visitors
This stat lets you know how many people are viewing your site for the first time, and how many are coming back time and again. Both are useful, and depend ultimately on what your goals are (new email signups? New visitors can measure success. Long-term education? Return visitors can indicate a sense that your content is valuable and worth returning to). - Bounce Rate
This indicates how many people leave your site after they’ve landed there. Lower is better, and tracking which particular pages inspire further exploring or taking wing to greener internet pastures is probably the best use of this particular stat.
Social Media
Social media can be harder to track, because often the goal is the difficult-to-quantify “interactions” or “relationships.” That said, there are a number of worthwhile tools we can use to measure the relative effectiveness of certain types of interactions.
- Using Traffic Sources in Google Analytics, we can track how much of our web site traffic comes in from social media sources like Twitter, YouTube, and Facebook. You can also use analytics to see what content is coming in from mobile browsers.
- Set up Google Alerts to track key words on the issue/campaign you’re working on – Google Alerts grab from Twitter and blogs, easy content to track (or share or otherwise interact with).
- Facebook insights provide extremely granular data on all different types of interactions with your content over a wide range of dates. It’s hard to manage using the Facebook interface, so your best bet is to download. Even then there’s an overwhelming amount of data, so simply delete almost all of the columns, leaving just a few key metrics behind:
- Weekly People Talking About This (Page Level – Key Metrics – Column C)
This is the number of people sharing stories about your page, including: liking your Page, posting to your Page’s Wall, liking, commenting on or sharing one of your Page posts, answering a Question you posted, RSVPing to one of your events, mentioning your Page, phototagging your Page or checking in at your Place. (Unique Users). - Weekly Total Reach (Page Level – Key Metrics – Column P)
The number of people who have seen any content associated with your Page. (Unique Users) - Lifetime Post Viral Reach (Post Level – Key Metrics – Column H)
The number of unique people who have created a story from your Page Post as a percentage of the number of unique people who’ve seen it. This is a good way to test how shareable your content is. This metric is an indicator of how likely your fans are to share your posts. - Lifetime Post Engaged Users (Post Level – Key Metrics – Column M)
The number of people who clicked anywhere in your posts. (Unique Users). Another way to parse engagement, this shows how many people are interacting with specific content – liking, sharing, viewing videos or photos, commenting, etc.
- Weekly People Talking About This (Page Level – Key Metrics – Column C)
- Twitter
With Twitter, you can do weekly check ins to manually count followers—we recommend keeping a spreadsheet to a tally once a week.- Keep in mind that the raw number of followers is pretty rough – lots of people follow and then just tune out
- Much more effective to track if you’re actually getting RTs and mentions
- Track what works and when in the spreadsheet.
- Take a look at Klout: It’s free – just plug your Twitter handle in and it’ll tell you your score. It calculates your reach, influence, the important networks you’re a part of, issues on which you have more influence, and which of your followers are high ranking network hubs.
- Use 3rd party apps to track data and trends. Tools like TweetDeck, HootSuite, and Seesmic are useful for scheduling posts and creating regular searches, but their biggest benefit is in tracking and analyzing Twitter account performance.
The bottom line:
Having goals isn’t enough—you also need to track your successes and failures. You should:
- MONITOR: Using stat-tracking tools available in Facebook, 3rd party Twitter apps, Google Analytics and alerts.
- ASK: Talk to people about how they’re coming across your information or finding out about your events – in person or using polls.
- LOW TECH: Count manually! Sometimes the best stats tracker is you. Also search Twitter and Facebook manually for mentions of your cause and groups or individuals that may be allies.
- TEST: What gets most comments? Are comments mostly positive/negative? What days/times work best for posting? How often is most effective? What type of content gets the most positive interactions?
- FOLLOW: keep up with what other organizations are doing (and when) by following/friending, and don’t be afraid to copycat.
Keeping in mind our circular process, don’t forget to take what you’ve learned from your data and actually put the stuff that’s working into practice!

Ride All The Rockies!
It was a quiet week at OnSight headquarters in Denver earlier this month. While the tumbleweeds were making their home in our offices, most of our staff was out exploring the state alongside Ride The Rockies.
The weather was spectacular and the tour was admirably well organized. For participants, volunteers, and staff (and OnSight employees numbered themselves among all three), it was an amazing and unforgettable week.
Highlights from our time with Ride The Rockies can be found on the RTR Twitter feed and Facebook page (we took the reigns of the RTR social media feeds for the week), YouTube account (we produced daily videos), and web site (collecting and posting content from the “Peak Pedaler” bloggers were our responsibility), and Flickr account (we took photos along the route, as well).
Our goal was to capture the spirit of the experience for riders and fans alike. Let us know what you think!
Watch the Videos
|
Day 1: A Change of Scenery
|
|
||
 |
|||
|
Day 2: Apres Ride
|
|||
 |
|||
|
Day 3: A Day in the Life
|
|||
 |
|||
|
Day 5: Beyond the Bike
|
|||
 |
|||
|
Day 6: Cañon City or Bust
|
|||
 |
Check out the Photos
Created with Admarket’s flickrSLiDR.

Pedal The Plains: Branding and Online Outreach Case Study
Objective: Use multiple online platforms to create Pedal The Plains brand, push share-worthy content throughout the social web, create buzz about the inaugural ride with the goal of raising awareness and interest, and increase registrations for the 2012 and 2013 rides.

Setting up a Flickr account and encouraging riders to post to the PTP pool is one way we created a shared community around the ride.
Strategy: Publish an ongoing stream of interesting content, interact with existing social hubs, and utilize fan-generated content as much as possible. Promote the ride as a mutually beneficial endeavor for cyclists and local plains communities—guests get a chance to see a part of the state that they may not have visited before, and local communities will see a tourism boost during the week of the event.
The Team: OnSight Public Affairs, Denver Post Foundation, Colorado Office of Economic Development and International Trade, and Governor Hickenlooper’s staff.
Challenge: OnSight was tasked with branding and developing an online presence and social media plan. Having worked with the USA Pro Challenge previously, OnSight knew the challenges of branding and promoting a cycling ride. As a new event, Pedal the Plains provided another list of obstacles, such as:
- How do we entice people to cycle in a region that has an agricultural landscape?
- How do we turn this event into a tourist draw that highlights the culture of rural communities in Colorado’s eastern plains?
Tactics:
- Built Pedal The Plains website using customized WordPress and branded with logo, colors and language.
- Developed and managed social media platforms including Facebook, Twitter, Flickr, YouTube and blogs.
- Created an extensive Social Media Roadmap, which provided guideines, content ideas, timing and posting best-practies, as well as a sketch of target benchmarks for the weeks and months leading up to the event.
- Prioritized responsiveness on social media to individuals posting questions, items that could be shared or responded to by the existing community (e.g., requests for carpool coordination), and posts to promote sponsors, participating towns, and partners for the event.
- Created blog series called “The Plain Pedalers,” where participants submitted daily updates and posts, giving the public an insider’s view of the ride.
Outcome: Pedal The Plains became not only a story in the paper for the public to read about, but an interactive experience for riders, as well as spectators and non-participants.
- Website had 32,927 unique visitors and spent an average of more than four minutes on the site.
- Email list grew to 2,249 subscribers and had an average open rate of 48.2%.
- Social media platforms engaged 1,629 followers.
OnSight will be teaming up for 2013 Pedal The Plains with the goal of making it even bigger and better than 2012.
Testimonial: “OnSight was instrumental in creating our event’s brand and shaping its culture. Their team demonstrated a keen understanding of all social media platforms and helped to make the ride an interactive experience. We look forward to partnering with OnSight for years to come.” –Chandler Smith, Director of Pedal The Plains
http://www.pedaltheplains.com/news/blog/