

Click to embiggen
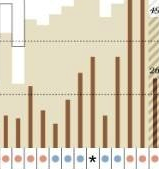
Cool graph illustrating the rise of the filibuster in Congress in the last 100 years. A curious quirk of our legislative process, as it turns out.
Part of series of fascinating political (and a myriad of other random) infographics from ILoveCharts.